How to Make Money Selling Data Analysis With Julius
Category: Monetization Guide
You can make money selling data analysis and reporting services with Julius, and a part-time operator realistically earns $500 to $2,000 a month after software. The work is taking a small business's messy spreadsheet, a marketer's campaign export, or a researcher's dataset and returning clean charts, a written insight, and a repeatable report, then billing per analysis for founders, marketers, and academics who have data but no analyst. Your tool bill is about $16 a month for Julius Plus, and you charge $50 to $200 per dataset. Last updated August 26, 2026 by the aifreetool editorial team. We verified every price on the vendor's pricing page in August 2026; this is an editorial guide and carries no affiliate links.
Quick answer: you are selling answers from data, not access to the chatbot. The buyers who say yes fastest are Shopify and Amazon sellers, solo marketers, early founders, and graduate researchers who sit on CSVs they cannot read.
Julius is covered on the Julius profile on aifreetool.site, and it is a conversational data analyst that writes and runs Python and R from plain-English questions, trusted by more than two million users. The full feature set and live plans are on the official Julius site. Here is the plan, the pricing, and the parts that go wrong.
What Julius Does and What It Costs
Julius ingests CSV, Excel, JSON, PDF, and Google Sheets, runs descriptive statistics, regression, ANOVA, and t-tests, builds publication-quality charts with ggplot2, Matplotlib, and Plotly, and can connect to databases like Snowflake, BigQuery, Postgres, and MySQL. For a service business the value is the barrier: a client asks "show me monthly revenue with outliers" in English and gets the chart and the code, no SQL degree required.
| Plan | Price | What you get | Best for |
|---|---|---|---|
| Free | $0 | Daily credits, basic analysis, file upload | Testing the flow |
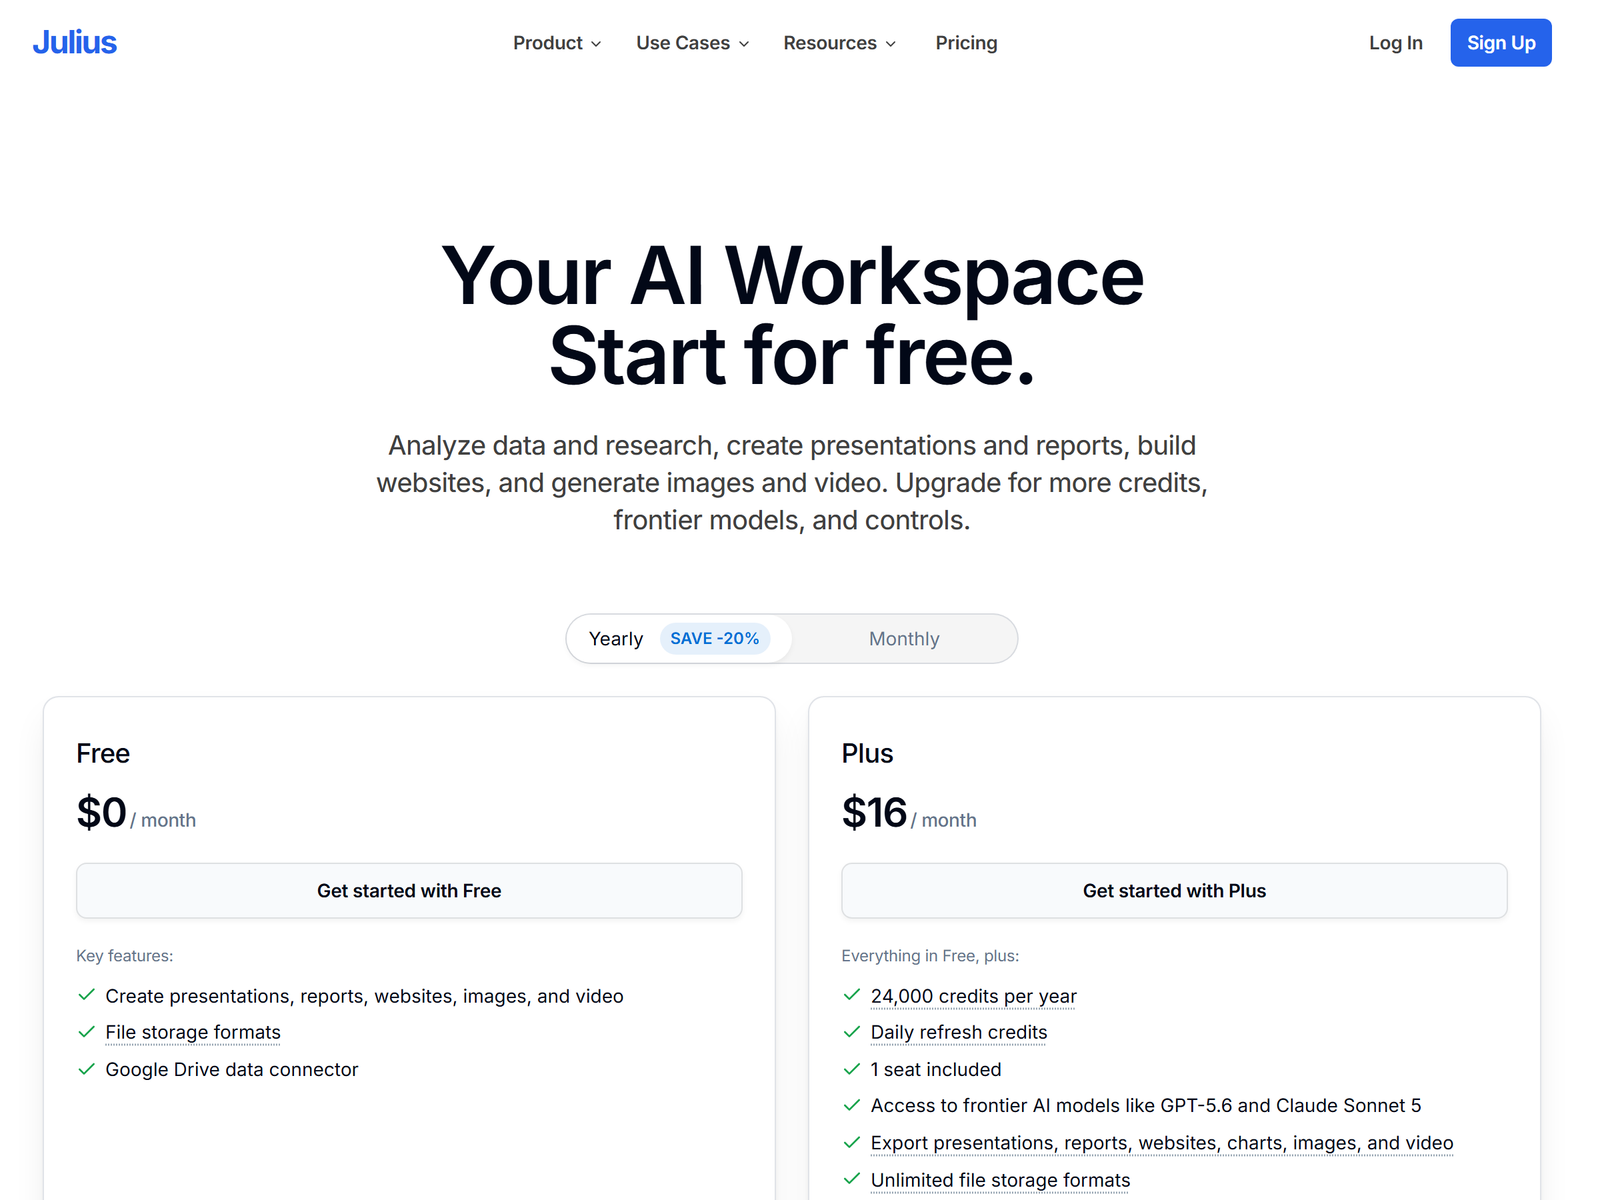
| Plus (annual) | $16 / month | 2,000 credits, frontier models, charts, Slack | Paid client work |
| Pro (annual) | $37 / month | 5,000 credits, scheduled reports, priority | Recurring client reporting |
| Business | $375 / month | Team seats, DB connectors, SSO | Agencies with analysts |
Plus at $16 a month billed annually is the floor for paid work: the 2,000 monthly credits cover dozens of analyses, and the chart and export tools mean you deliver a PNG and a PDF, not a screenshot. Free's daily allowance dies exactly when a client needs a ten-step exploration. Pay Pro at $37 only when you run scheduled monthly reports for several clients, because the automation justifies the step up. Move to Business at $375 only when you manage a team of analysts on shared databases.
The Service You Sell and What It Pays
Sell an analysis, a dashboard build, or a report retainer, not "Julius access". Price by the question and the recurring value.
- One-off dataset analysis: $50 to $200. Charts plus a written insight on a single file.
- Marketing or sales data audit: $150 to $500. Ad spend versus revenue, cohort, or funnel breakdown.
- Monthly KPI report build: $200 to $800. A scheduled notebook that emails a PDF every month.
- Academic or research stats: $40 to $150 per analysis. Regression, ANOVA, or a clean figure.
- Retainer: $300 to $1,000 a month. Ongoing questions for one founder or team.
Two retained clients at $300 to $1,000 plus one-off audits put you between $900 and $2,000 in revenue against a $16 tool bill. Realistically a part-timer handles four to ten analyses a week, because each is an upload, a question, a chart check, and a write-up, not a Python session from scratch. The buyers who say yes fastest are Shopify sellers wanting profit by SKU, solo marketers proving ROI, early founders reporting to investors, and grad students needing a correct figure.
Step-by-Step: From First Chart to First Paid Client
- Open Julius Plus and analyze three of your own CSVs to learn the question style and exports.
- Pick a lane: e-commerce analytics, marketing ROI, or academic stats.
- Build a before-and-after: a raw sheet versus a clean chart with a one-line insight.
- Share a sample report and a one-page price sheet, then ask for a paid $80 analysis.
- Take the client's file, ask the core question, check the output against the raw rows.
- Generate the chart, export PNG and PDF, write the insight in plain language.
- Deliver the files plus a short "what this means" note and the next question to ask.
- Offer a monthly report retainer the moment they want it repeated.
- Stay on Plus at $16; move to Pro only when you automate client reports.
Quality Control and the Pitfalls
Julius can misinterpret an ambiguous column or a sparse dataset, so always verify the headline number against the raw rows before it reaches a paying client, because a wrong chart is worse than no chart. The second trap is scope: Julius is built for ad-hoc single-file analysis, not live dashboards or complex multi-table joins, so sell a report, not a real-time BI stack, and point enterprise needs elsewhere. The third trap is privacy: client data is sensitive, so use a clean account, never paste unreleased data into a shared workspace, and state your handling practice up front. Finally, set a question cap per job, because unlimited "just one more cut" requests erase the margin on a $50 analysis.
FAQ
Is Julius Plus worth $16 if I know Excel?
For client service work, yes. Julius turns a plain-English question into a chart and code in seconds, and the $16 is nothing next to a $150 invoice. Excel still matters, but Julius covers the parts clients cannot wait for.
Can I sell Julius analysis commercially?
Yes. You provide the analysis service; Julius is your tool. The client owns their data and the delivered report, and you keep the method.
How many clients before I need Pro?
Four to ten analyses a week on Plus is plenty. Move to Pro at $37 only when you run scheduled monthly reports for several clients.
Should I promise live dashboards?
No. Sell a scheduled report or a one-off analysis, never a real-time dashboard, because Julius is ad-hoc by design and multi-table joins are unreliable.
How long does one dataset analysis take?
Roughly 10 to 30 minutes including upload, the question, chart check, and write-up, against hours of manual spreadsheet work. That speed is the offer.
My Take: The Bottom Line
The software is not the moat. Anyone can pay $16. What clients pay for is a person who understands the business question, checks the number against the raw data, and explains the chart so a non-technical founder acts on it. Julius writes the code; you supply the skepticism and the plain-English translation.
My honest read: this is the highest-leverage analytics business in this category because every founder sits on data they cannot read and the tool cost is tiny, but it rewards operators who actually verify the output, not ones who forward the first chart. It is a poor fit for anyone uncomfortable with basic statistics, and it is not passive income. The tool profile is at the Julius page on aifreetool.site, current plans are on julius.ai/pricing, and more playbooks sit in our Monetization Guides. Subscribe to Plus tonight, analyze three files, and charge for the first real job this week.