How to Make Money Designing Infographics With Piktochart in 2026
Category: Monetization Guide
Reviewed by the aifreetool.site editorial team. This guide is an independent how-to for our readers; we have no affiliate relationship with Piktochart and earn nothing if you sign up. Here is a practical way to turn the tool into client income in 2026.
Quick answer: can you make money with Piktochart?
You can make money with Piktochart in 2026 by selling infographic and report-design services to businesses that have data but no in-house designer. A solo operator typically earns $500 to $2,000 a month producing infographics, one-page reports, and slide decks, while a small agency can clear $3,000 to $5,000 a month by white-labeling the work. The tool turns CSV files, survey results, and blog posts into polished visuals in minutes, so your time goes into client acquisition and niche expertise rather than pixel-pushing.
Key Takeaways
- Piktochart turns client data into infographics, reports, and decks in minutes.
- Realistic solo income is $500-$2,000/month; agencies reach $3,000-$5,000/month.
- Start on the $10/mo Pro plan - the free tier only allows two downloads.
- Win by owning a niche (HR or nonprofit reports), not generic "design."
Piktochart at a glance
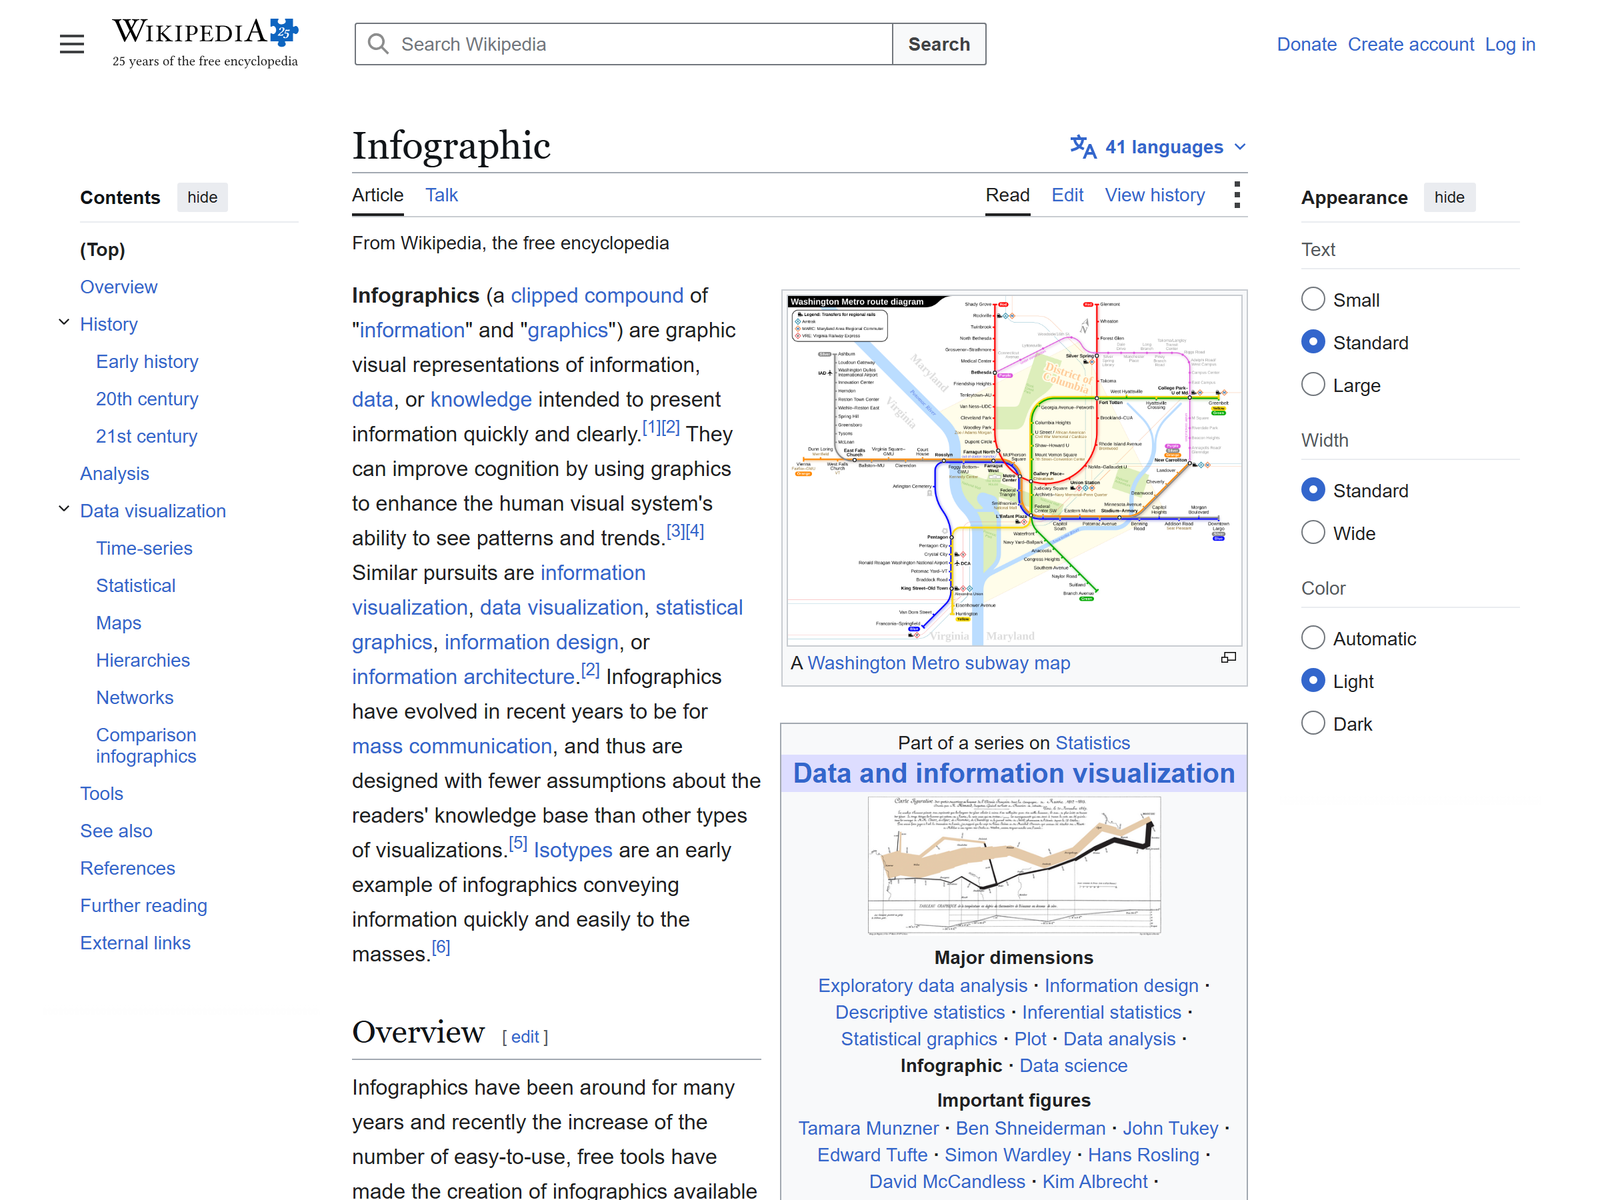
Piktochart is a web-based visual content tool built around infographics, reports, presentations, posters, and flyers. It ships a drag-and-drop editor, a chart and map builder that imports straight from CSV or Google Sheets, and an AI design generator that produces a first draft from a short text prompt in under ten seconds.
Its current pricing (verified September 2026) runs:
| Plan | Price (billed annually) | Best for |
|---|---|---|
| Free | $0 | Testing only - 2 PNG downloads, 60 AI credits |
| Pro | $10/mo ($15 monthly) | Solo sellers - unlimited PNG, 500 AI credits, 5M+ assets |
| Business | $17/mo ($20 monthly) | Client work - PDF/PPT export, full brand kit, 1,000 credits |
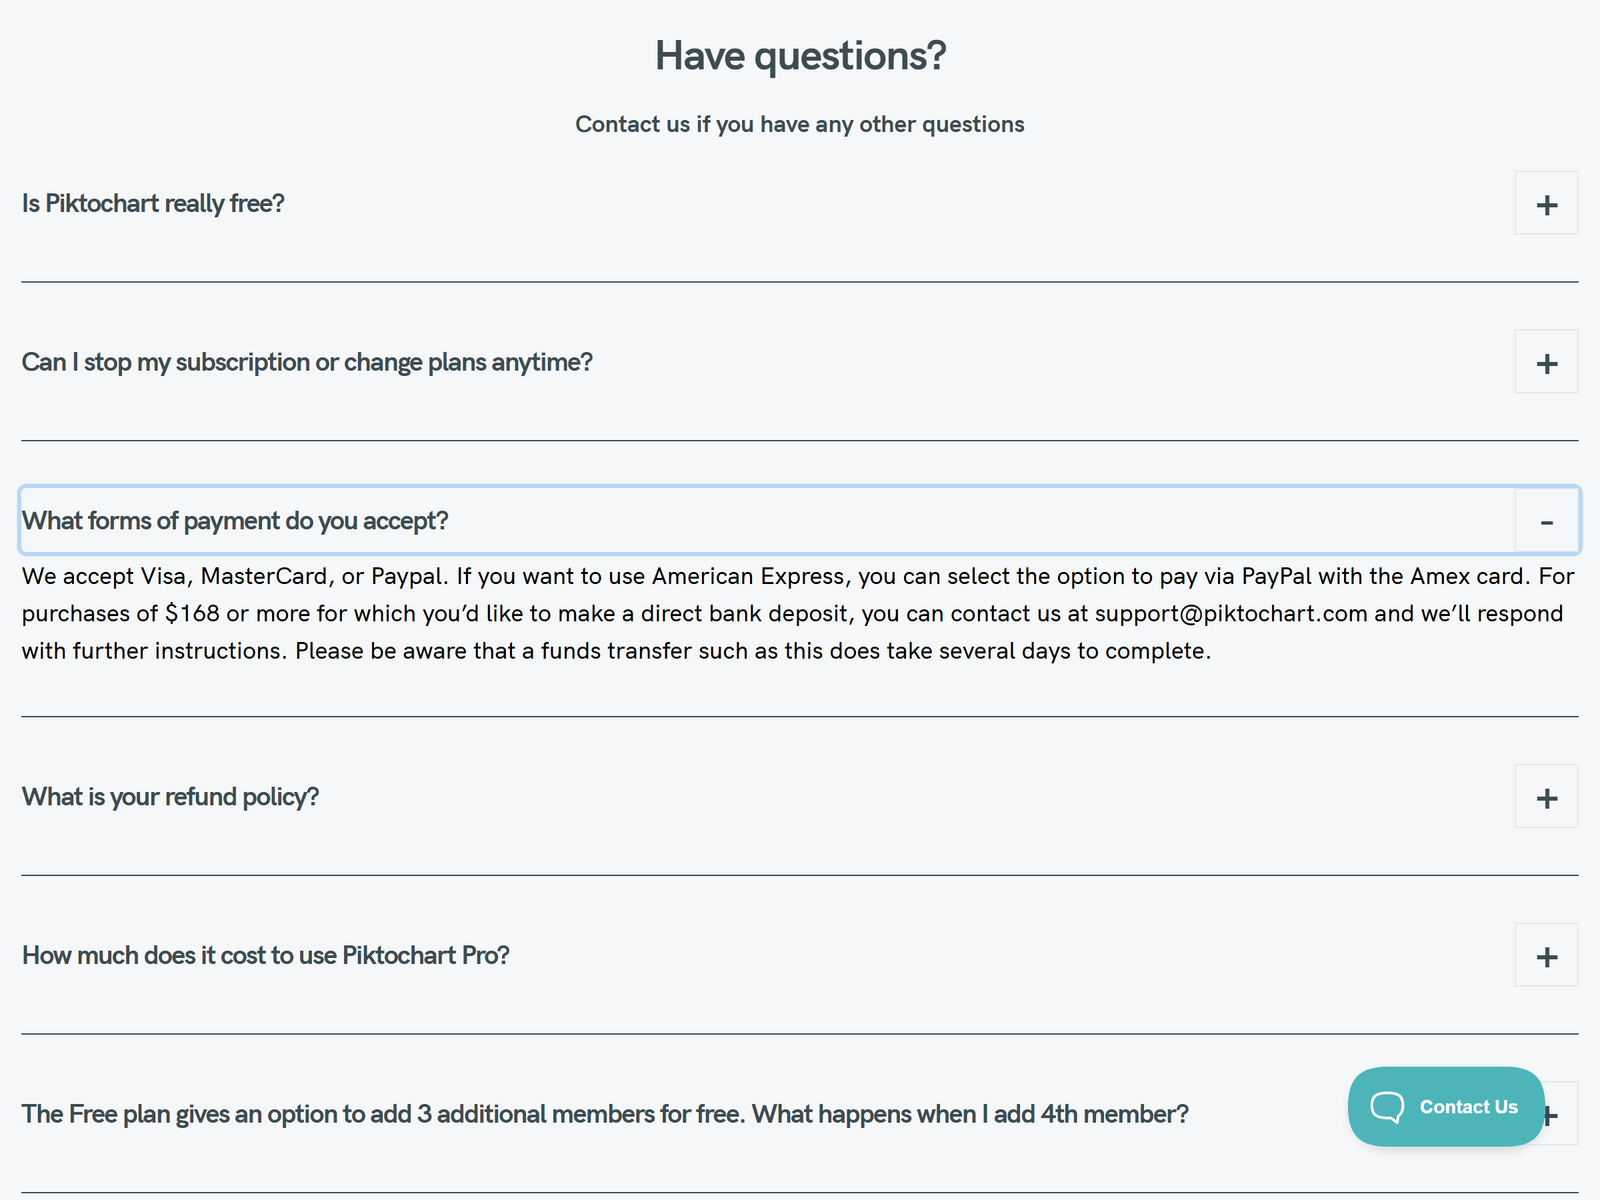
For a service business you want at least the Pro plan, because the free tier caps you at two downloads a month - not enough to deliver paid work. The Business plan matters once you start white-labeling, since the brand kit keeps every deliverable on the client's colors and fonts. Piktochart reports 34 million users and 220 million visuals created, which tells you the template library is deep enough to look original with light customization.
The monetization idea: sell "data-to-visual" design
The gap you fill is simple: most small companies sit on quarterly numbers, customer surveys, and case studies they cannot present well. You take that raw material and return a shareable infographic or report. Concrete packages:
- Single infographic: $30-$120 depending on data complexity and revision rounds.
- Report package: one-page summary plus a slide deck, $150-$600.
- Monthly retainer: 4-8 visuals for an agency or nonprofit, $400-$1,200.
Where to sell: Fiverr and Upwork for quick starts, then direct outreach to HR teams (benefit infographics), SaaS companies (feature explainers), and nonprofits (impact reports). You can see the tool's own page at our Piktochart review, and compare it with broader design options like Canva or the spreadsheet angle in Numerous.ai. For the full tool directory, browse aifreetool.site.
Step-by-step: from sign-up to first paid client
- Open a Pro account and work through three templates (infographic, report, presentation) so you can reuse them.
- Pick a niche. Nonprofits, HR, or B2B SaaS convert fastest because they have data and weak design.
- Build a sample. Take a public dataset (a city budget, a survey result) and make one strong infographic. This is your portfolio piece.
- List a gig. On Fiverr, title it around the outcome: "I will turn your data into a professional infographic."
- Deliver with source files. Export PNG plus the editable Piktochart link so clients can tweak later.
Managing clients and quality
Set revisions up front - two rounds is standard, extra costs more. On the Business plan, save each client's brand colors and fonts as a brand kit so every visual stays consistent. Deliver PNG for social, PDF for reports, and PowerPoint for sales teams; Piktochart handles all three on Business. Keep the editable link private until final payment to avoid unpaid reuse. Always show one revision at low resolution before sending the final high-resolution file.
Pro tips and pitfalls to avoid
Do: bundle three infographics plus a one-page report into a named package - it raises the average order from $40 to $200. Use Piktochart's AI Studio (nine image tools including background remover and upscaler) to add product shots inside infographics. Don't: promise custom illustration or pixel-perfect vector art - that is Adobe territory and will burn your margins. Avoid the free plan for delivery; the two-download cap will strand you mid-project. Also resist the urge to overload one visual with every chart you can find - clarity sells, clutter does not.
Who this is and isn't for
It is for non-designers who can learn a template system and sell to data-rich but design-poor clients. It is not for anyone needing fully bespoke illustration, print-ready vector logos, or animation - those need a specialist tool or designer.
My Take / The Bottom Line
Piktochart is one of the easiest design tools to monetize because the buyer already has the hard part - the data - and just needs it to look credible. The realistic play is a niche infographic service, not generic "design." Start on the $10/mo Pro plan, ship ten samples, and price by package. The risk is race-to-the-bottom Fiverr pricing, so protect your rate by owning a vertical (HR or nonprofit impact reports) where buyers value clarity over cheapness. Full pricing is on Piktochart's pricing page. More guides in this series live in our Monetization Guide category.
FAQ
Do I need design skills to sell Piktochart services? No. The templates and AI generator do the layout; you supply structure, data, and client management.
Which plan should I bill clients on? Pro for solo delivery, Business once you manage multiple brands, because the brand kit keeps client files separate and on-style.
How fast can I produce one infographic? A simple data infographic takes 20-40 minutes once you have a template; complex reports run a few hours.
Where do I find clients? Fiverr and Upwork for first orders, then LinkedIn outreach to HR and marketing managers in your niche.
Can I white-label the output? Yes. Business plans remove the Piktochart logo and let you apply client brand kits, so the work looks in-house.